Drata
Enterprise Risk Management
Research / User Testing / Prototyping / Design / UATThe time had come for Drata to move upmarket in the Risk and Compliance industry, from the SMB organizations that had been their bread and butter and begin capturing enterprise prospects.
I led the redesign of Drata’s Risk Management product for enterprise customers, helping retain three at-risk accounts that were considering switching to a competitor.
Discovery
No formal user research had been done when the Risk Management product was initially developed. I desperately needed to understand the experience of our users, internal and external alike, in order to successfully anticipate and address needs.
External customers were selected based on product usage and company size. Trends in the resulting data would be used to shore up the current product and extrapolated to flesh out future enterprise features.
Customer support and sales teams were interviewed to understand friction points, feature gaps, and motivators behind prospective customers declining to sign with Drata. I dug through our extensive archive of recorded customer calls. All of these findings were synthesized, tagged, and published for product teams across the company to use.
Wireframes, user flows, and low-fidelity designs were created as my research effort continued.
Research Methods
Card sortingRemote moderated testingKey Findings
Customers supplemented their workflows with Excel to solve missing functionality and product’s rigidity.
Concept testingDiary studiesEvery organization’s risk management methodology was unique. There was no significant overlap or standard at all.
Semi-structured user interviewsCustomer call recording archive searchesUsing multiple registers to manage risk programs that spanned products and regions was the biggest ask among enterprise customers.
Legacy code was our biggest hindrance as the original product was built a la carte with no components used whatsoever.
We Needed A Solid Foundation.
There were nearly a dozen hard coded, bare-bones tables deployed in the app, all of which were limited in the information they could display. The design team had recently started work on a new design system. During a company-wide product meeting, I proposed that enterprise risk sponsor the much needed table component for the entire app.
The opportunity to solve not only issues I’d uncovered during research, but also remove the bottleneck holding up app-wide feature development in other products appealed to executive leadership and the other teams.
This new component gave users full control over their data including freezing and hiding columns, sorting, and role-based custom views. It created a standardized, agile experience for the app as a whole, and gave the risk team a scalable foundation upon which we could build features.
The Strategy
We Had to Deliver Quick Wins for the User.
Working with the product manager, I scoped and designed a number of features that both laid the foundation for enterprise solutions and solved issues that had been identified during discovery.
These new features included custom risk creation and scoring, a full reporting dashboard suite, an employee onboarding and education wizard, and a Role Based Access Control system.
With these deployed, we were able to provide a consistent release cadence for customers that met immediate user needs while serving long-term goals.
These delivered solutions were instrumental in retaining three existing enterprise customers who had expressed the desire to switch to a competitor. Being able to offer the opportunity to test drive the new component and offer feedback also did much to assuage some of the frustrations.
We Needed a Clearly Defined North Star.
The true enterprise product had to accommodate complexity and a litany of unique methodologies. Most of our customers had supplemented our experience with Excel to actually be able to manipulate data for these exact reasons.
Knowing that every organization approached risk assessment and management differently, the humble table component became a significant aspect of the product's foundation. This, along with the RBAC feature, allowed for a number of enhancements to the central risk library including team creation and assignation, the ability to go from macro to micro views of the organization's risk posture, and the management of risks across departments, subsidiaries, and countries.

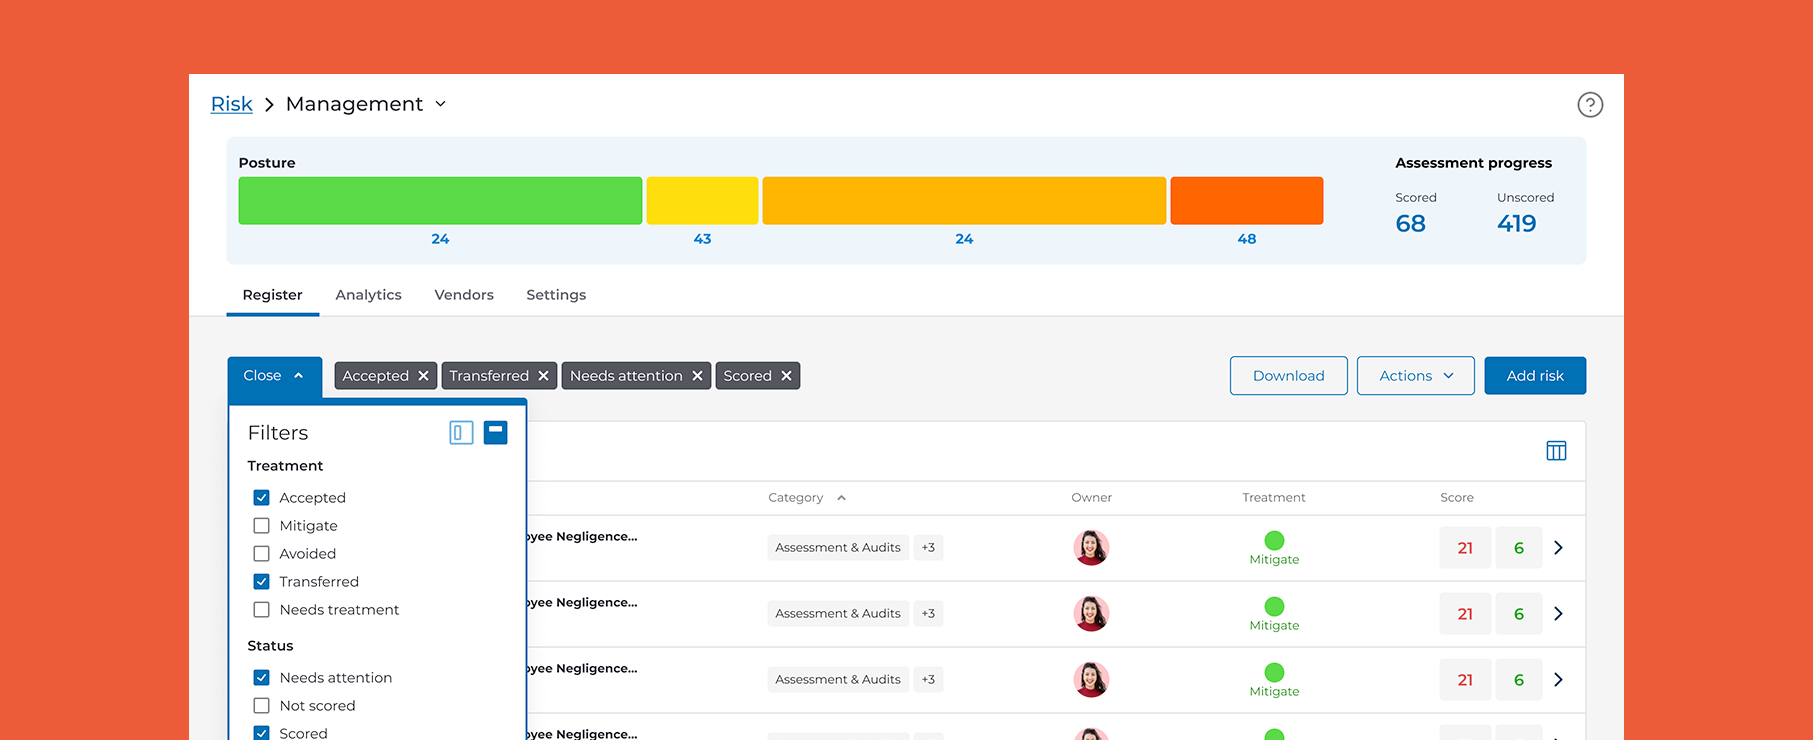
Pinned filters allowed us to make better use of the horizontal space like the Excel experience that users had indicated they preferred. Table rows were cleaned up and standards defined for the variety of data that might be present. Everything was designed with responsive fallbacks for smaller viewports.
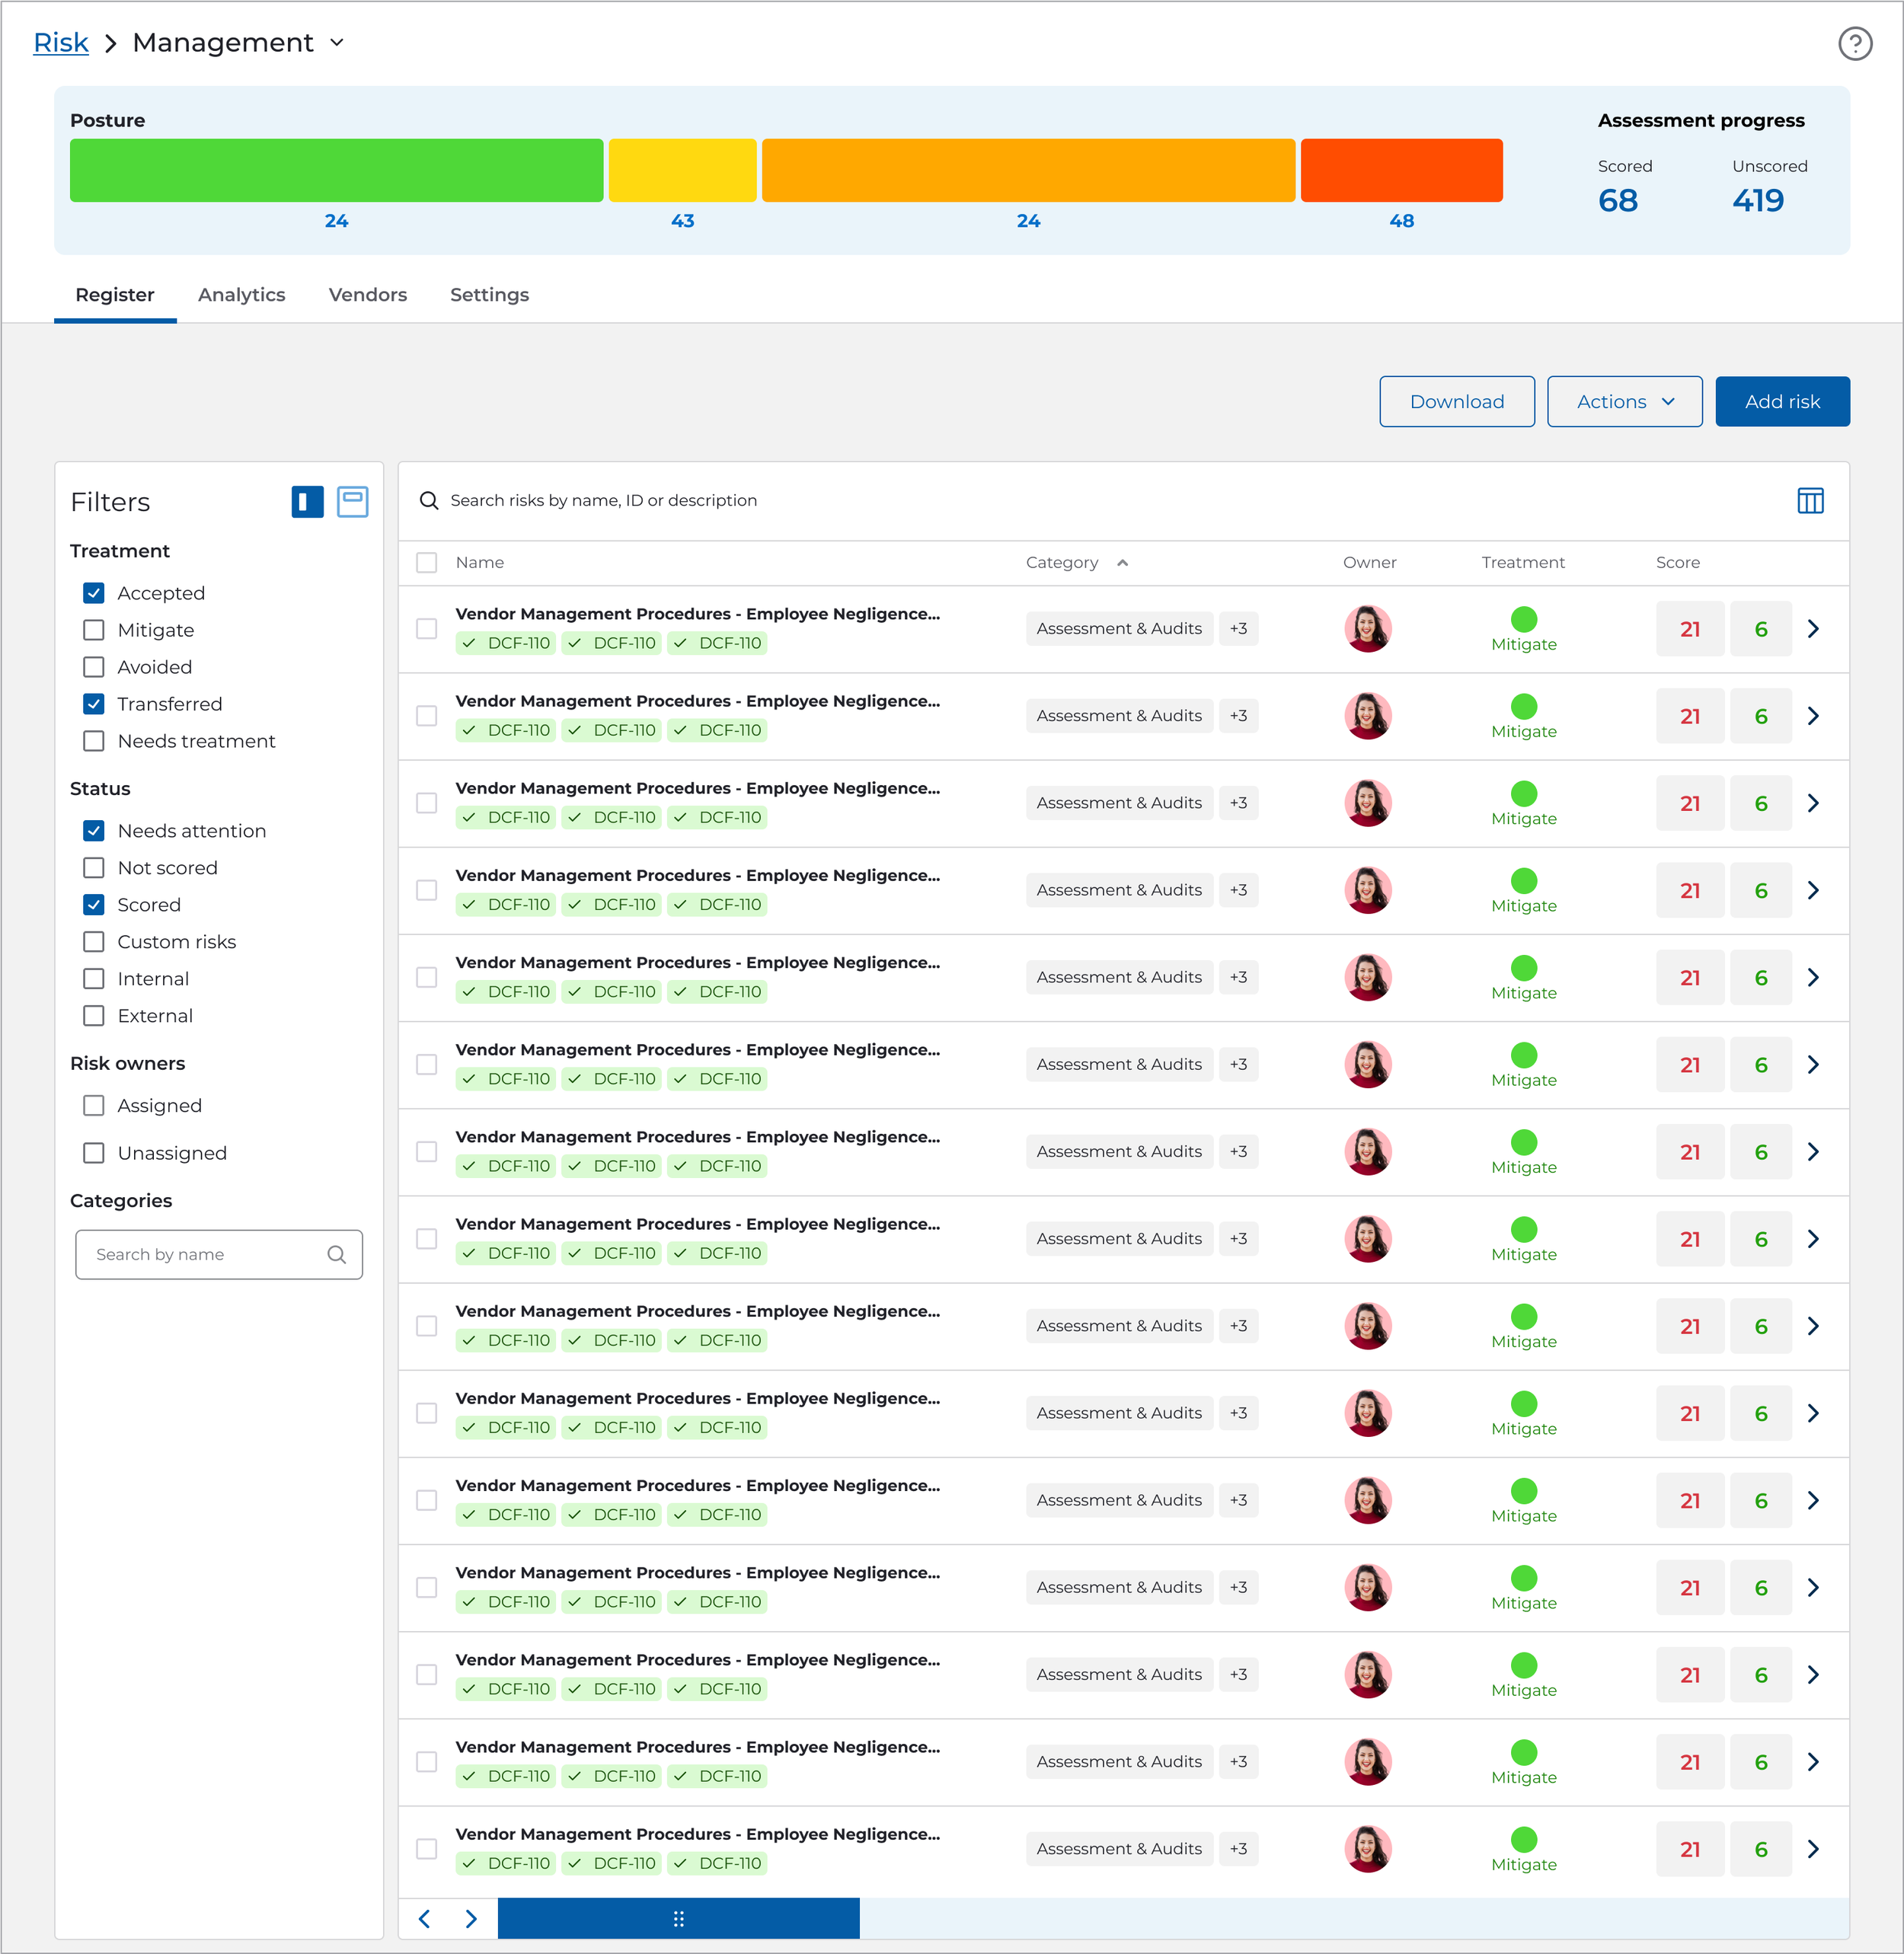
A toggle in the filters section allowed users to anchor the filters within the page as well if constant visibility was preferred. Table settings triggered by the icon in the upper right opened a modal. Data points, information density, and other quality of life settings are located here.
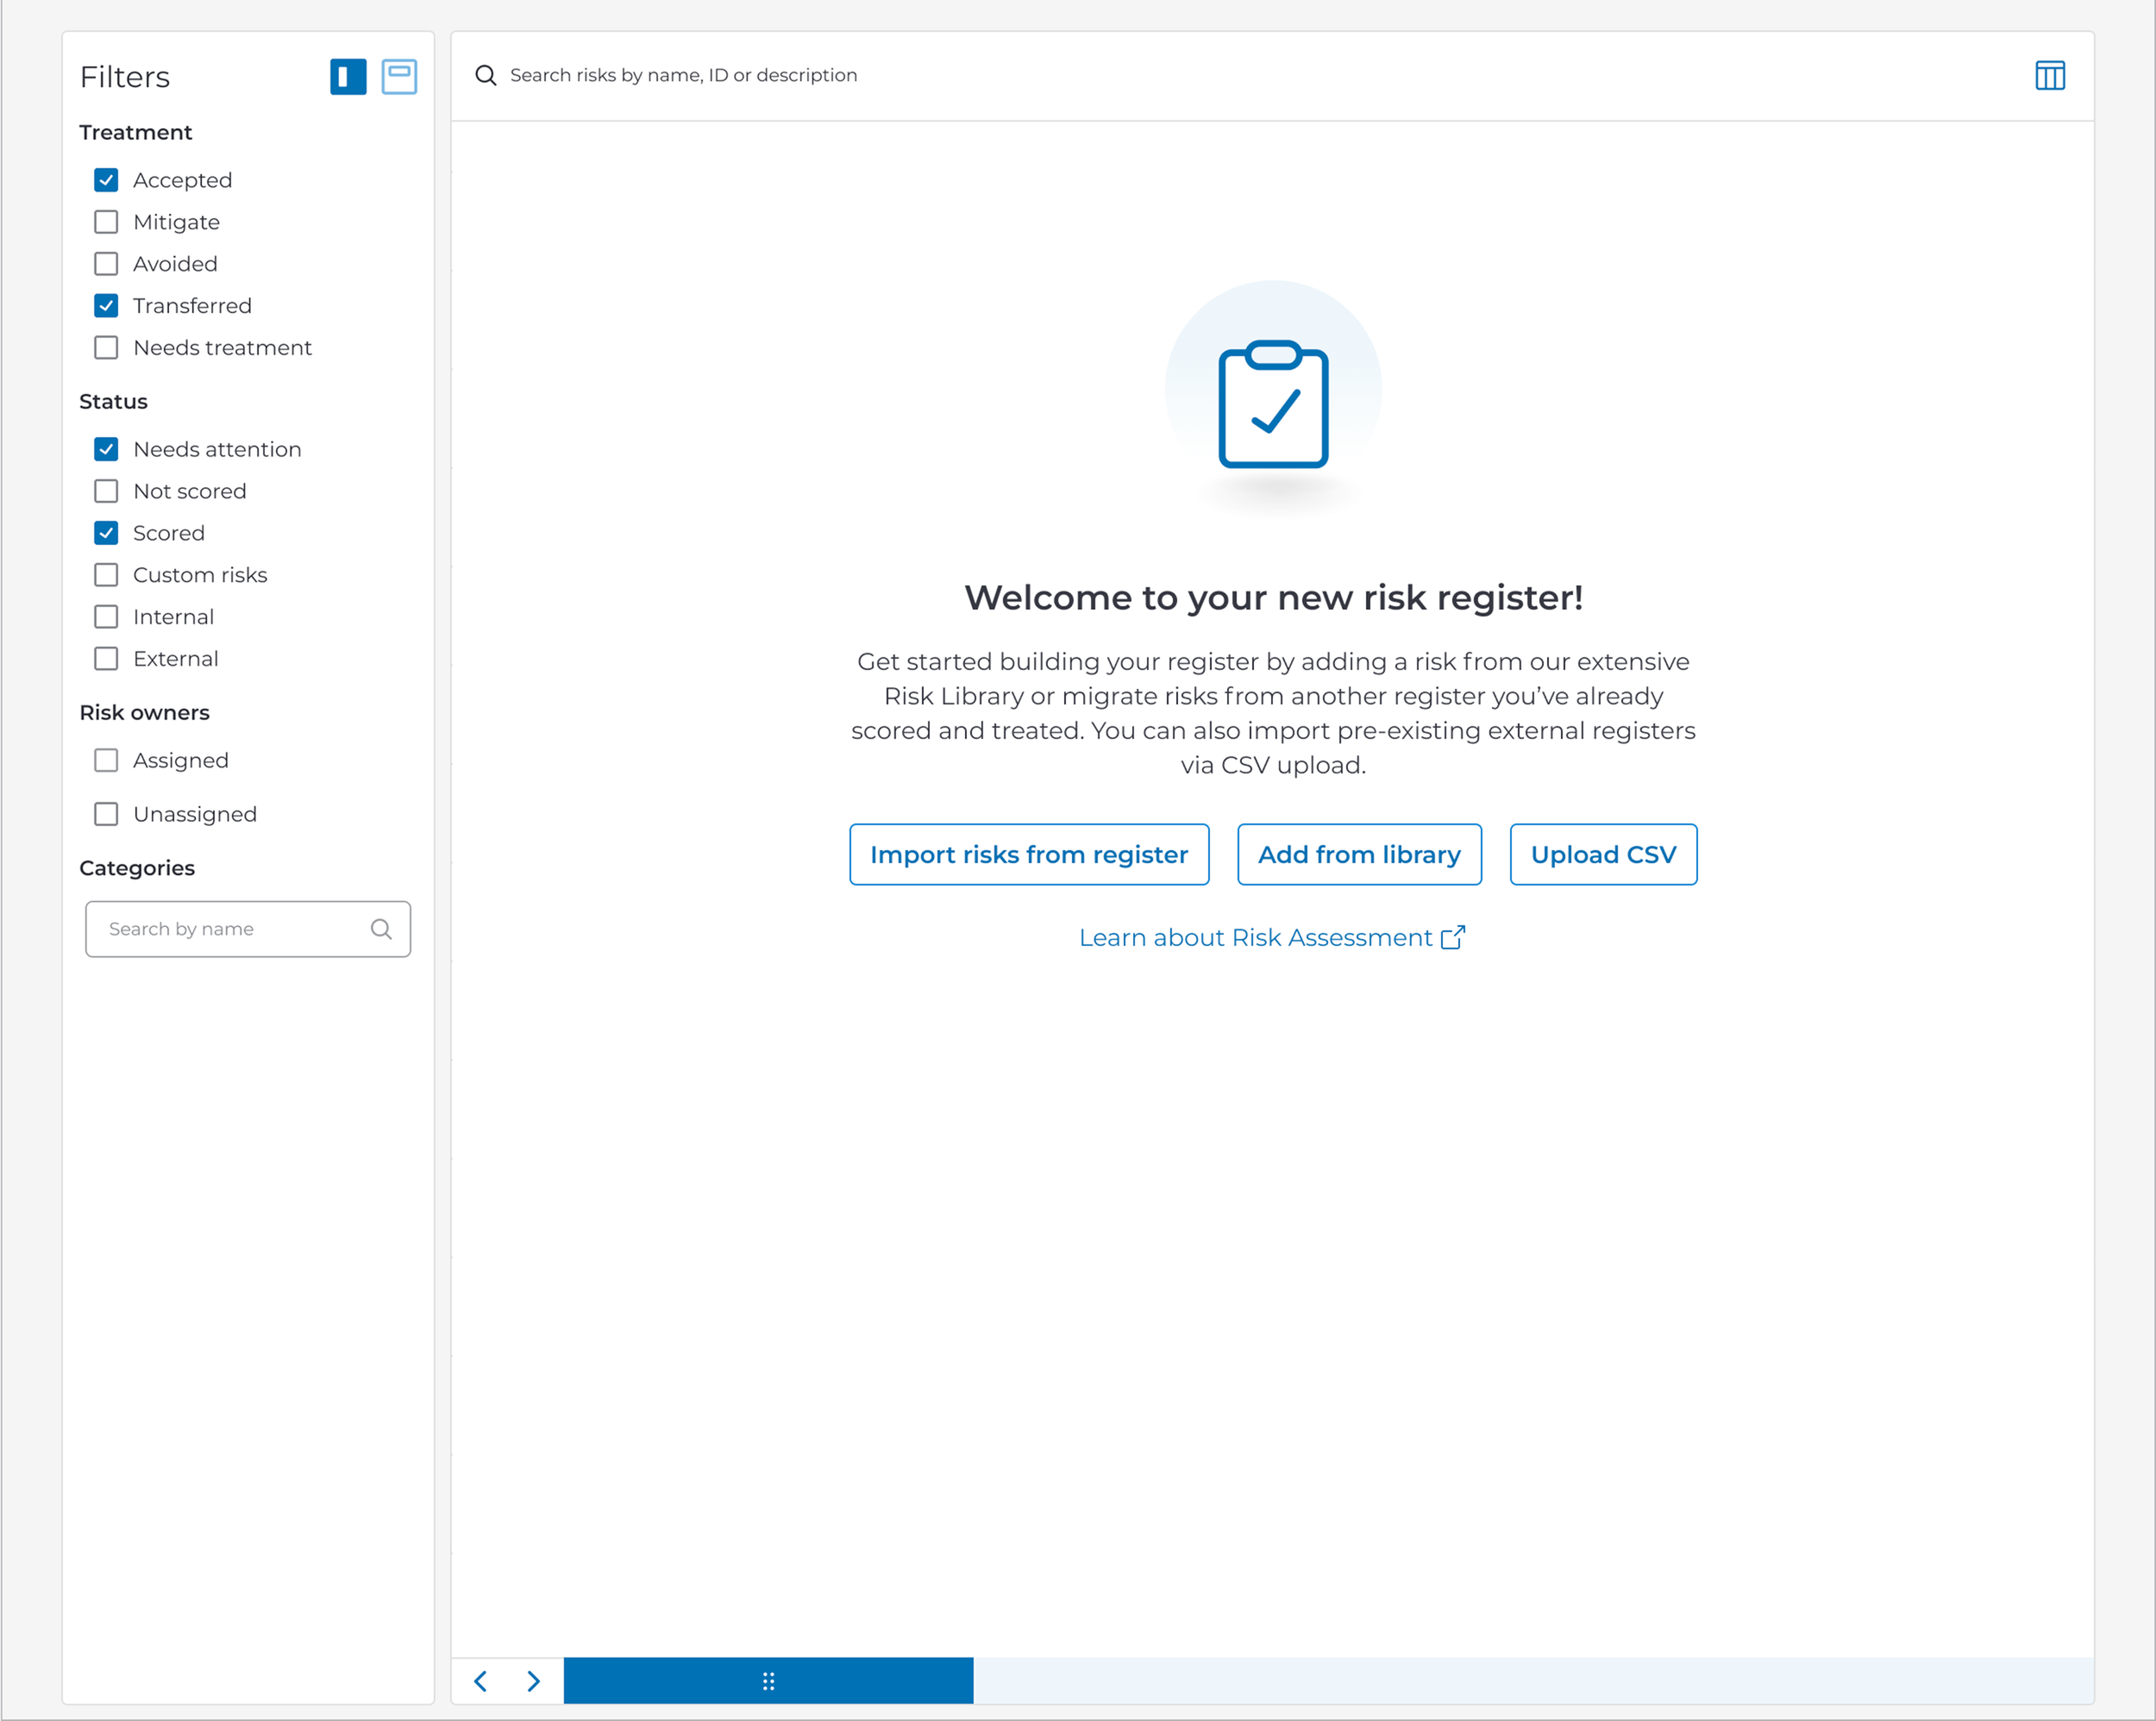
An empty state that accommodated all possible personas was designed. Each avenue for beginning the risk assessment process was laid out with an additional path to Drata's help articles. While there were plans for conditional empty states that were delivered based on organization size or industry, I designed a static catch-all for MVP purposes.
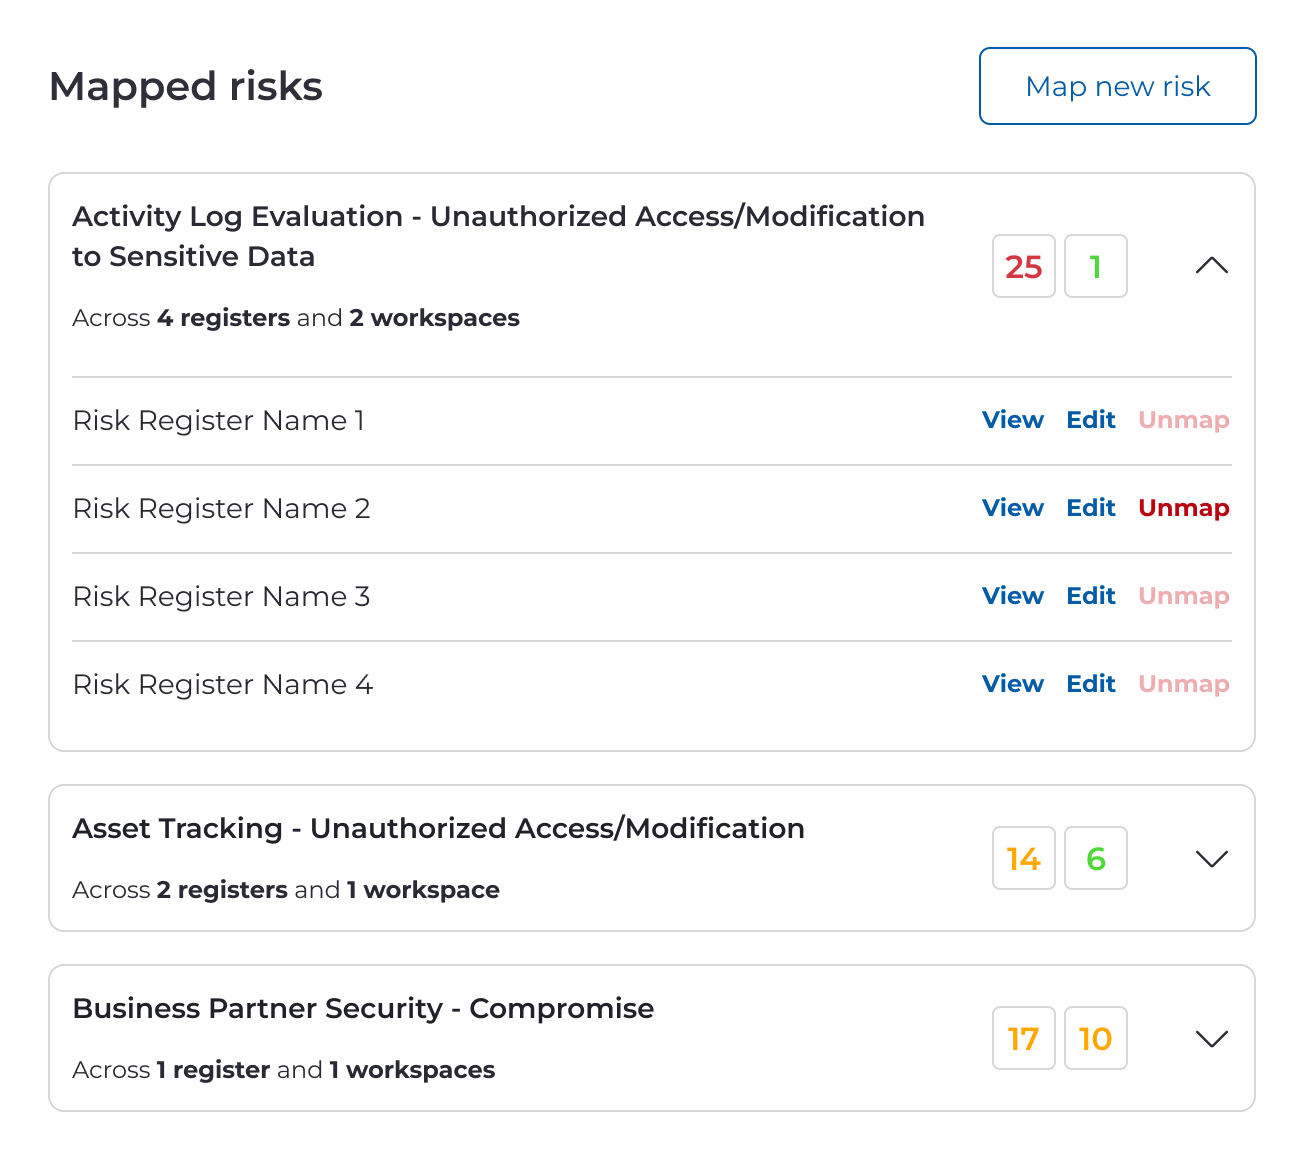
Each risk is supported by a multitude of Controls objects which function as criteria and evidence that the organization has taken steps to mitigate the risks. These are seen in the register images as the "DCF-123" pills below the risk titles. With the introduction of enterprise risk scaling, I designed a way that people administering controls could see where each one was being used, have access to the register(s) it appeared in, and take action directly if they had permissions to do so.
Multi-register dashboard desirability studies
In addition to the core component, I also began work on updated risk library and risk register experiences based on research findings. Wireframes and low-res multi-register dashboards concepts were also designed and shared with internal stakeholders, and then tested with a core set of customers.
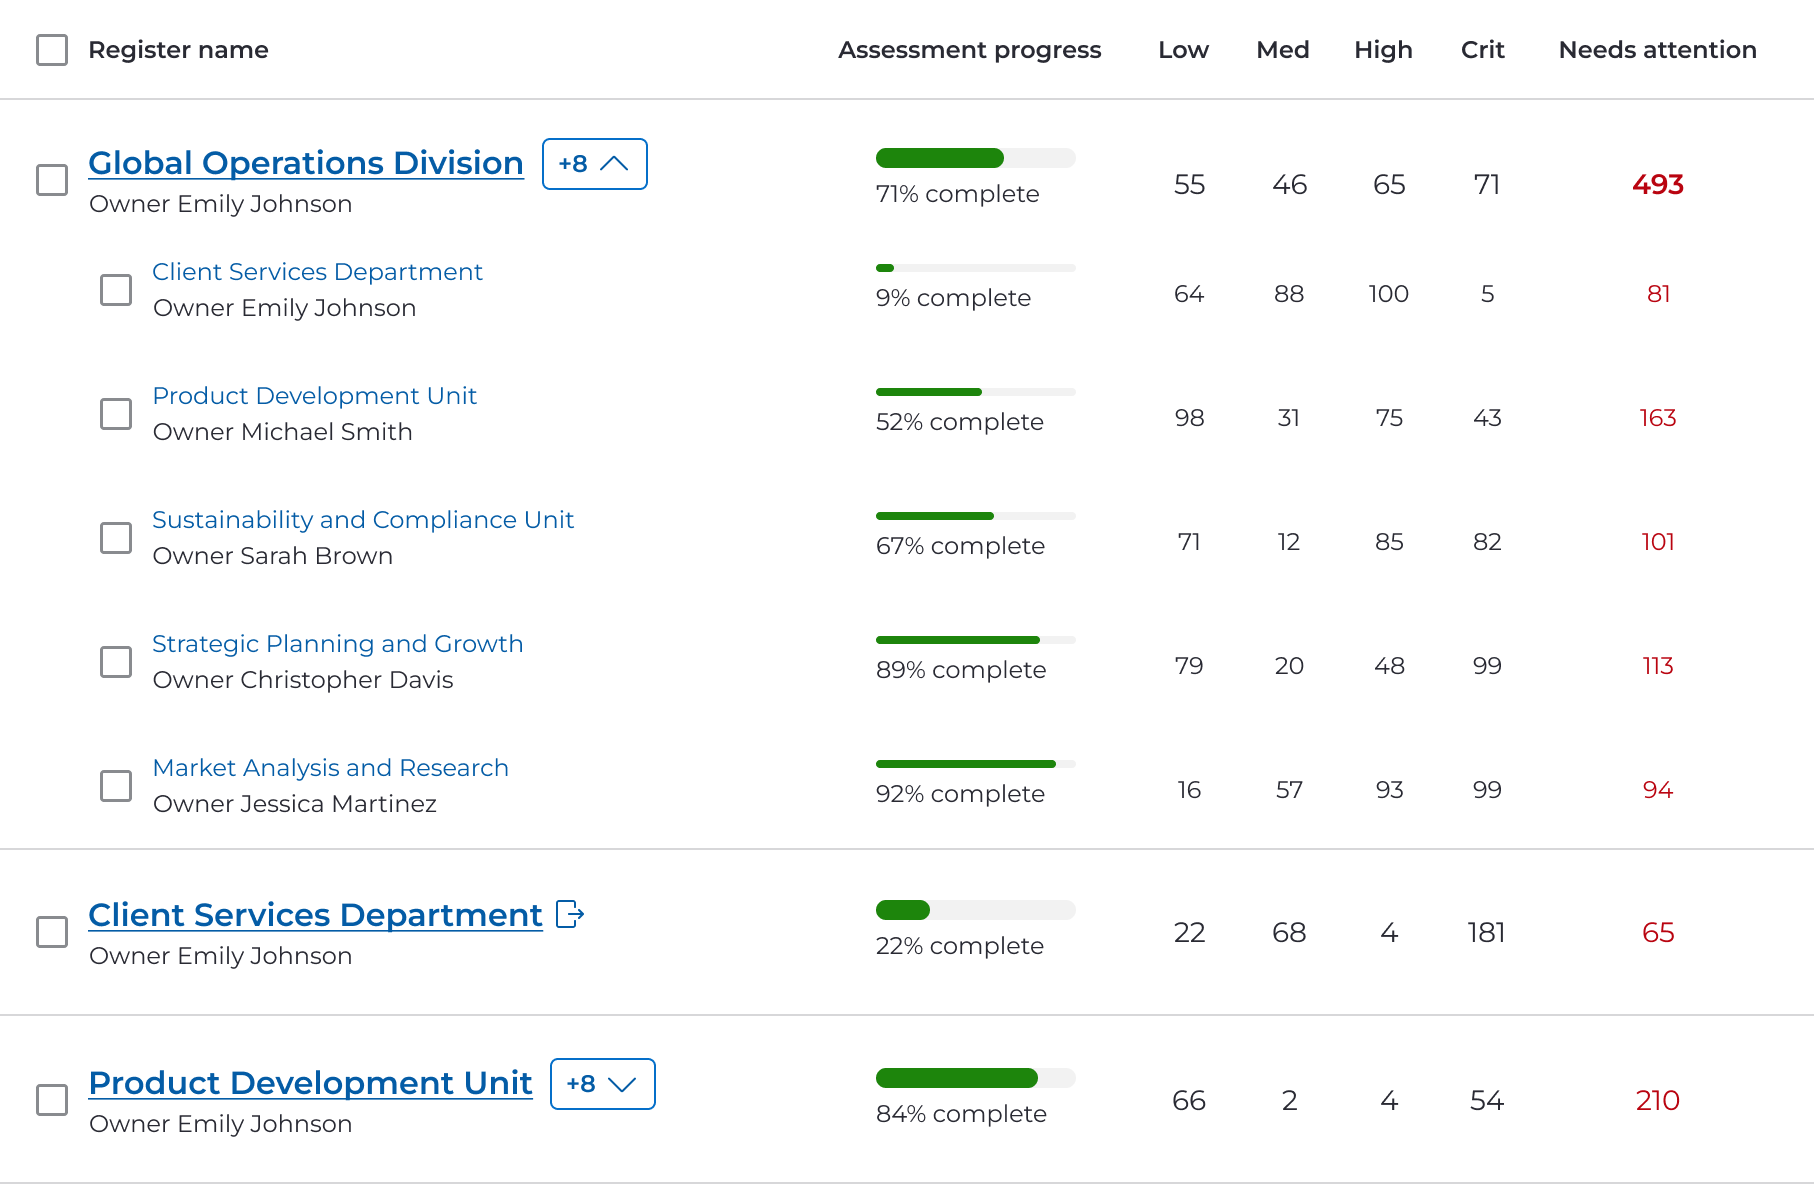
Dashboard concept: multiple, nested registers across divisions, products, and regions
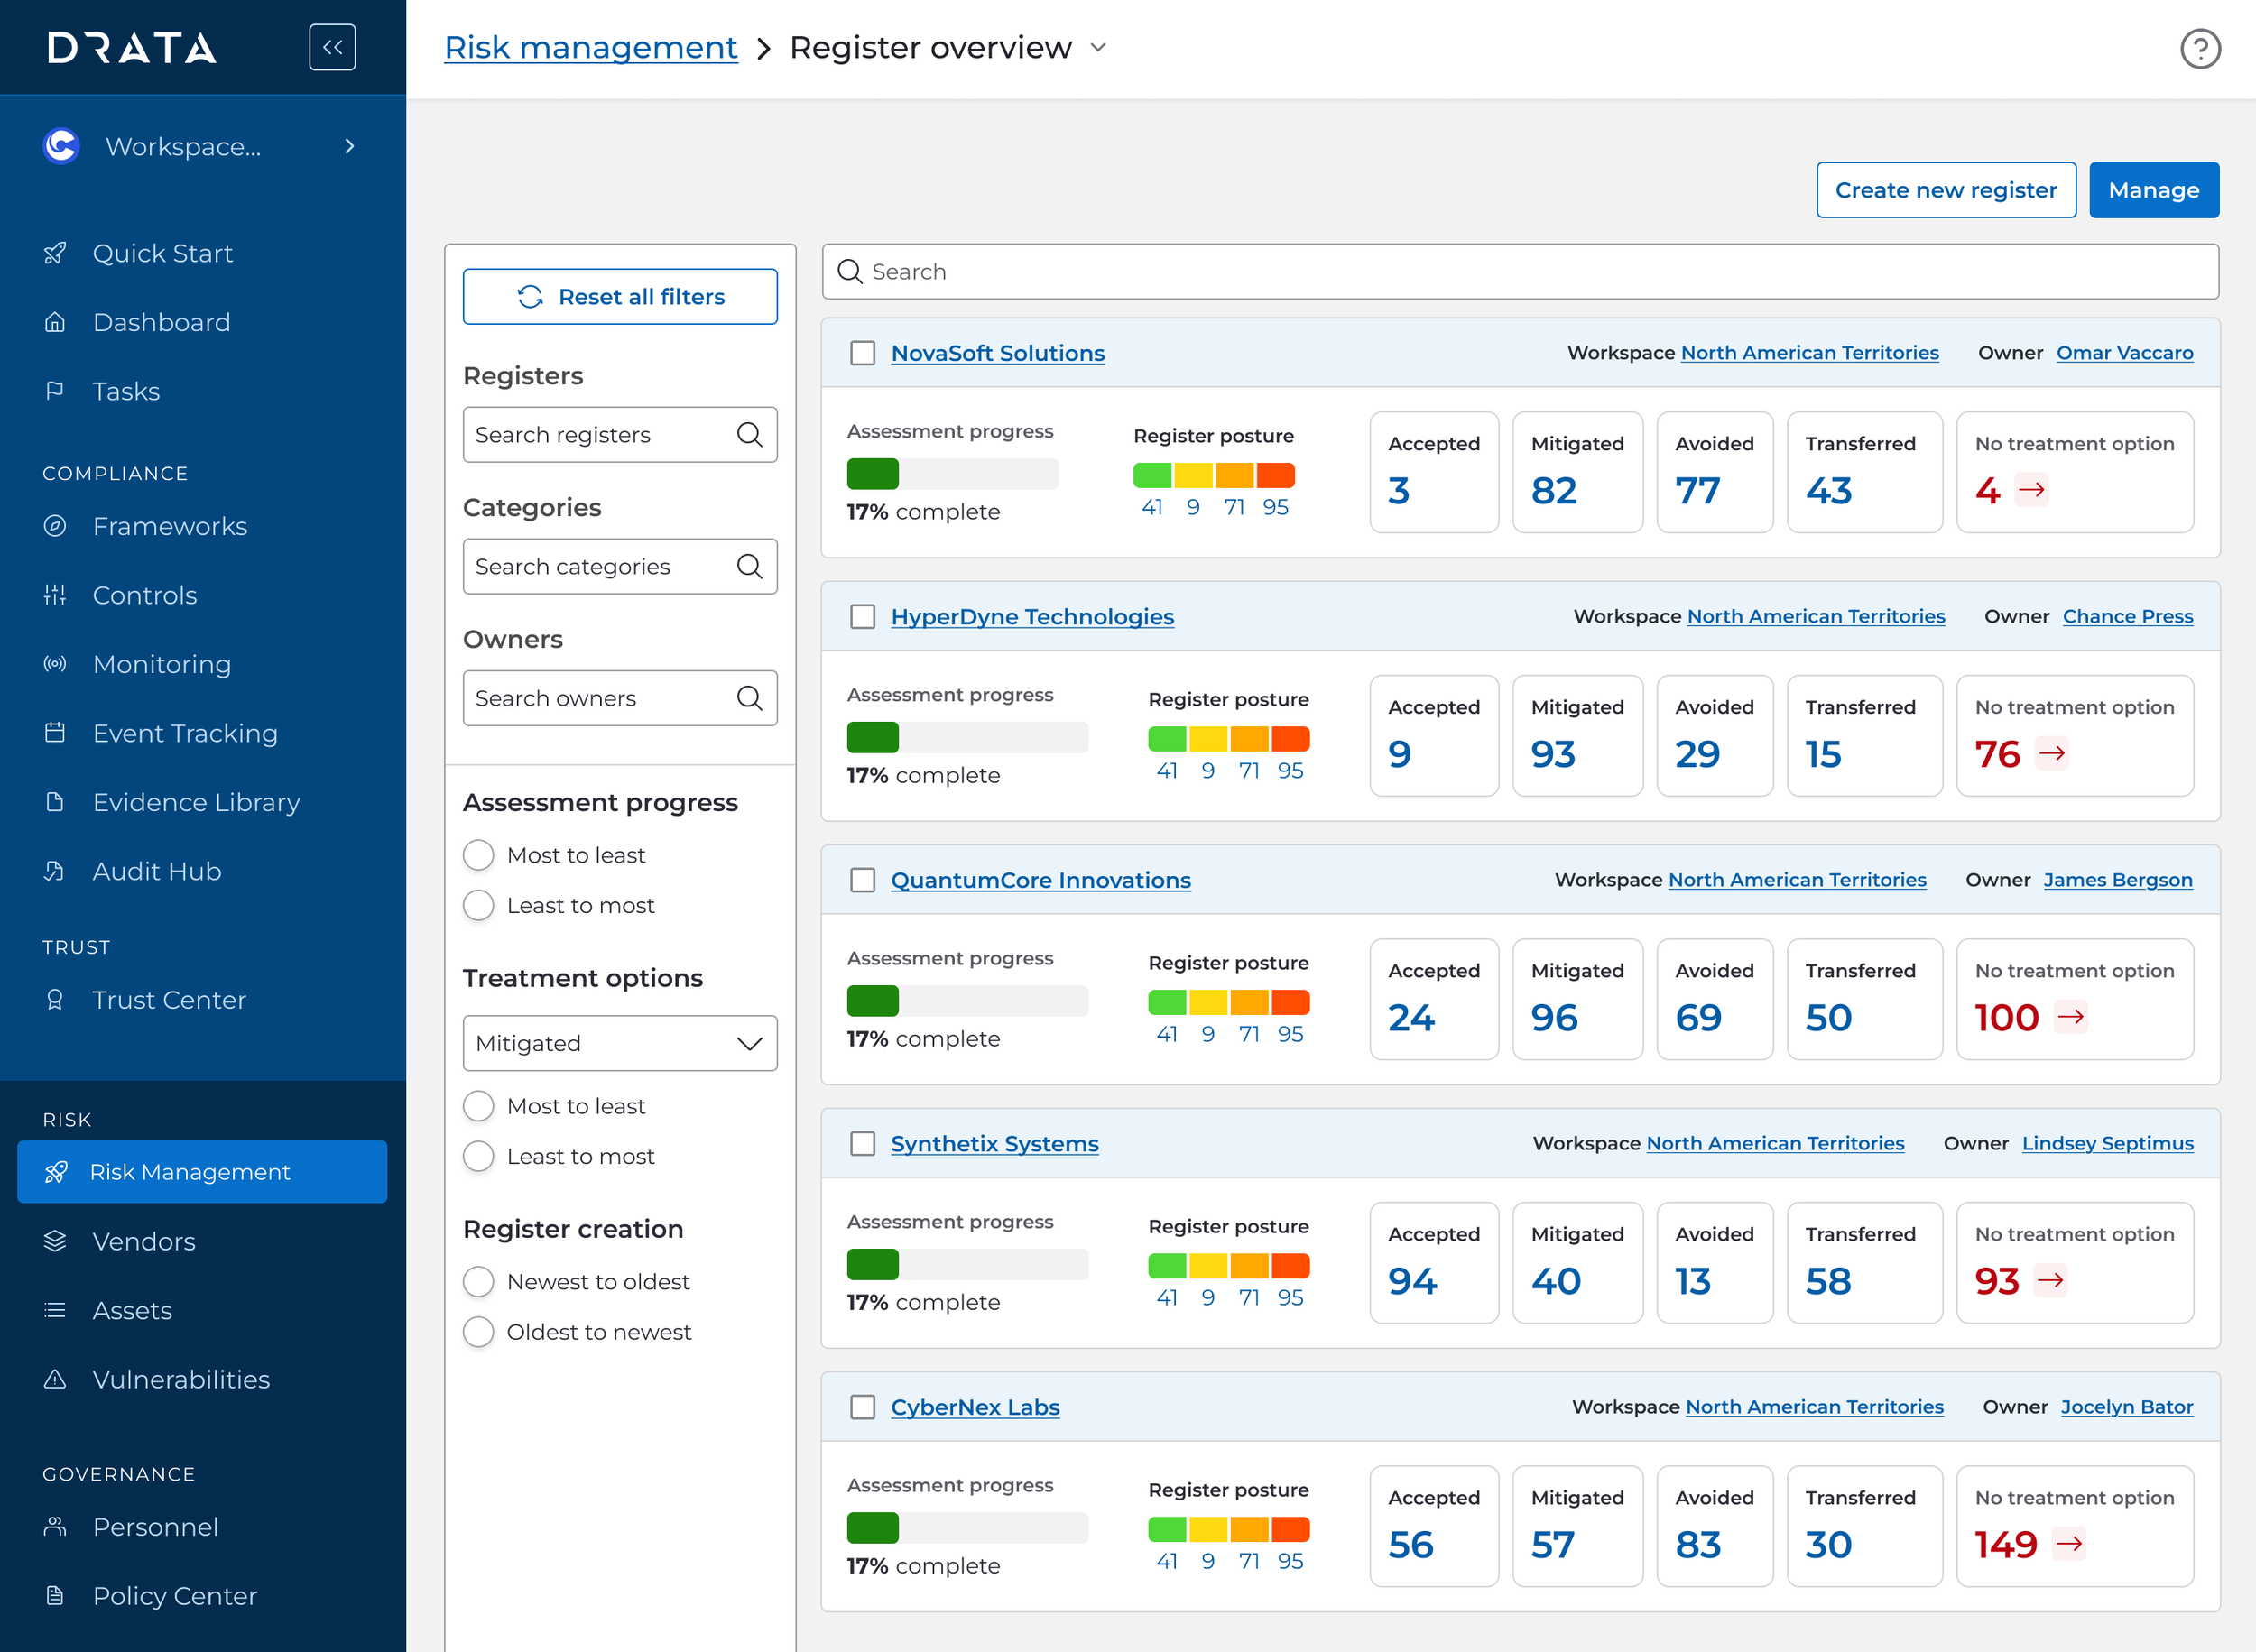
Dashboard concept: multiple, discrete registers
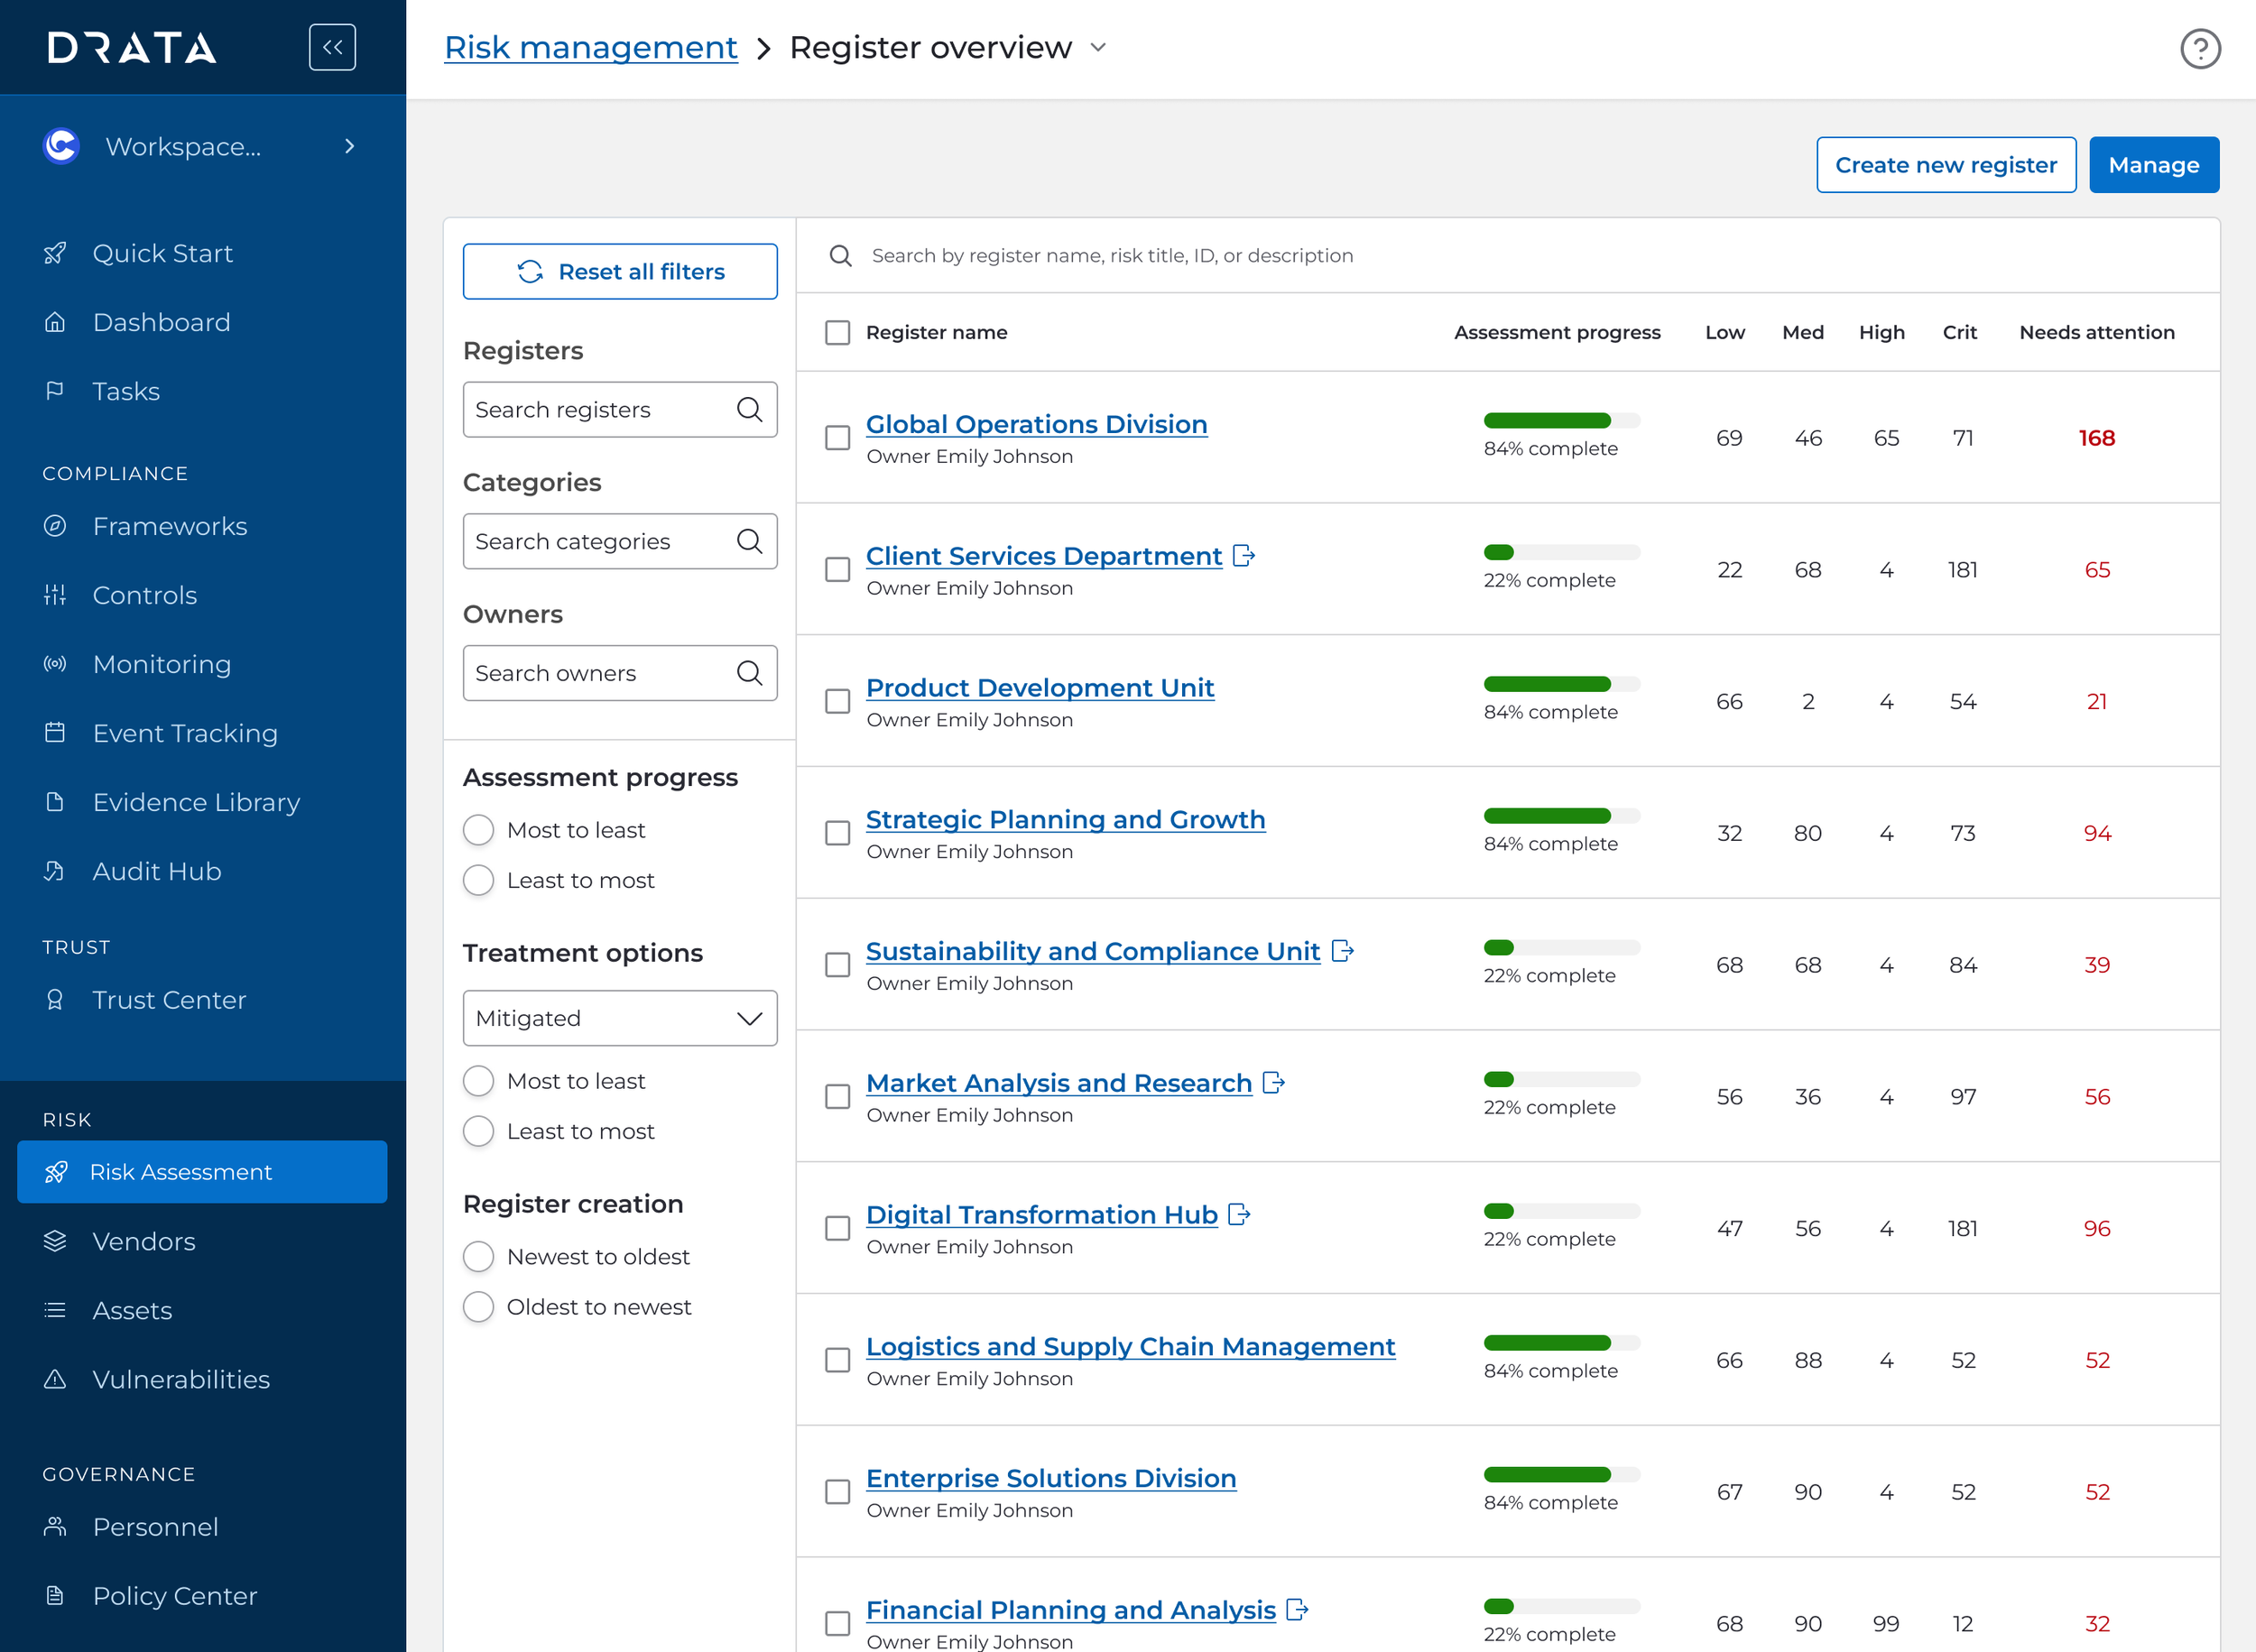
Dashboard concept: multiple registers, full user control over data manipulation
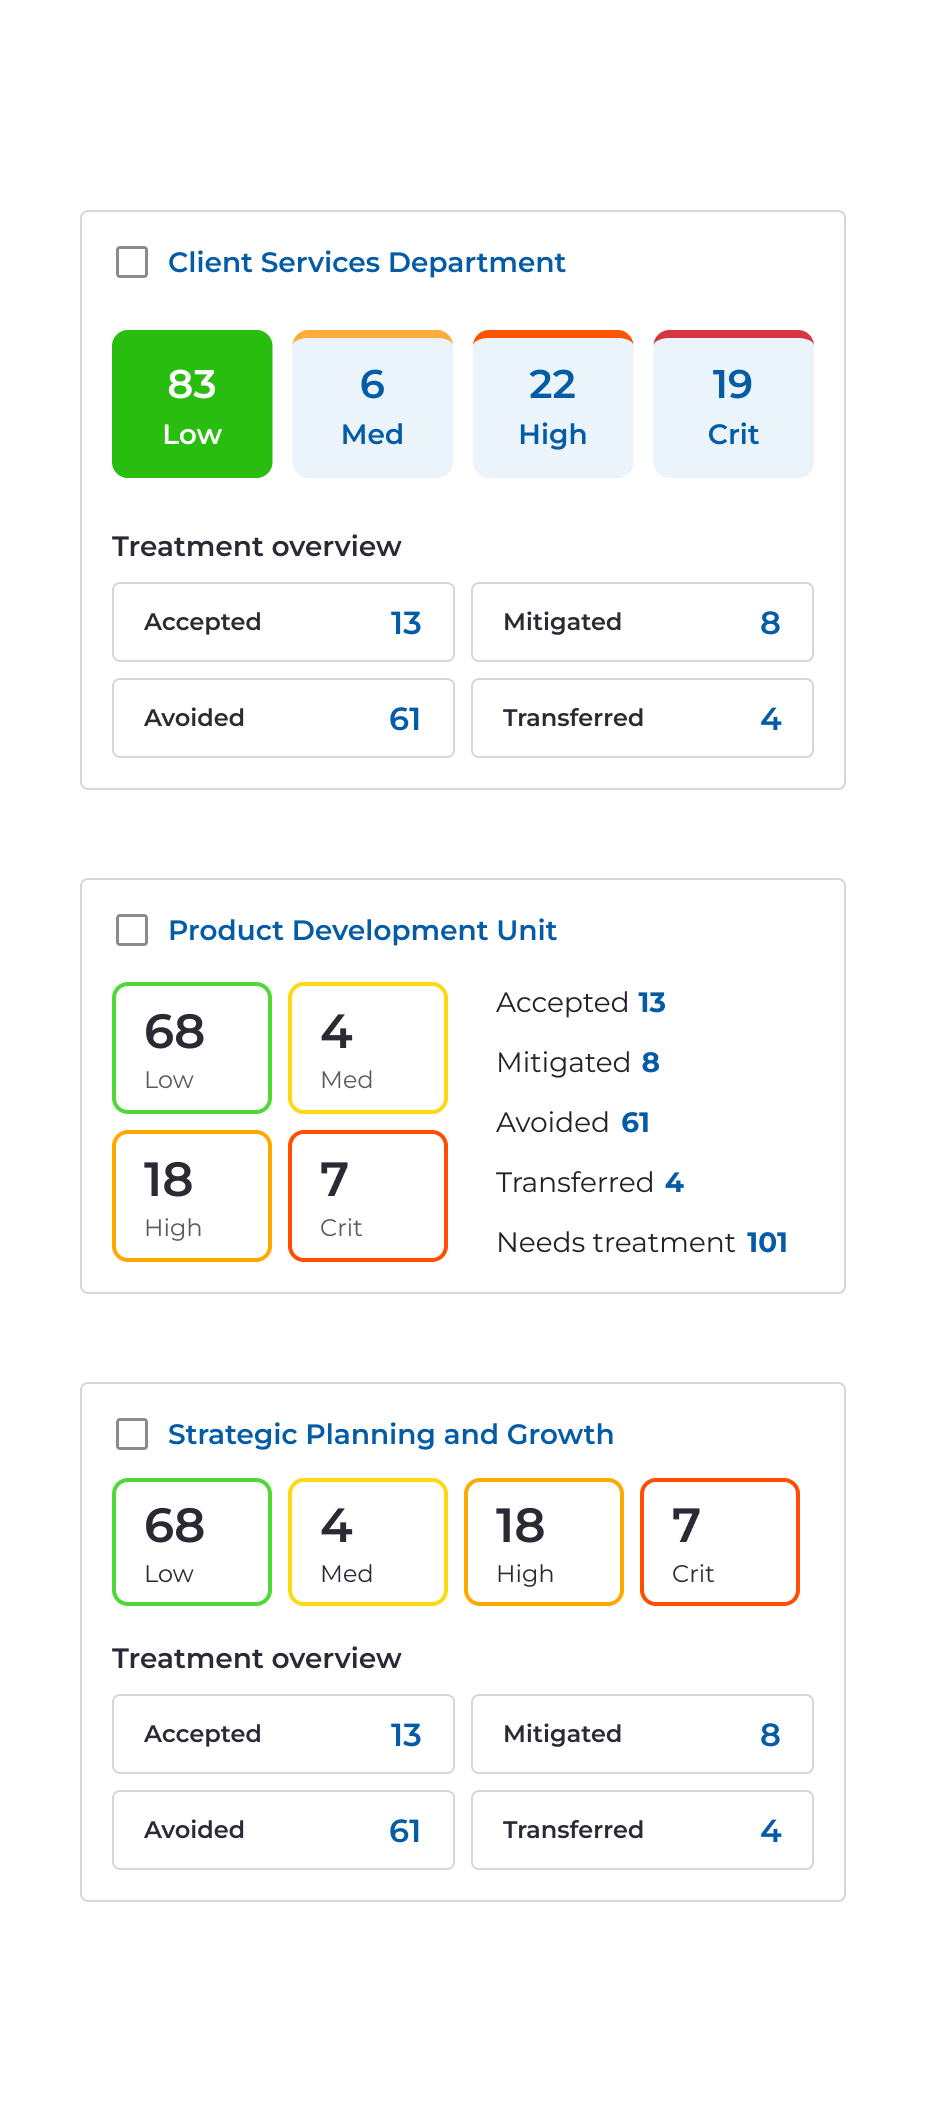
Dashboard concept: discrete register cards